


Statistics by Class
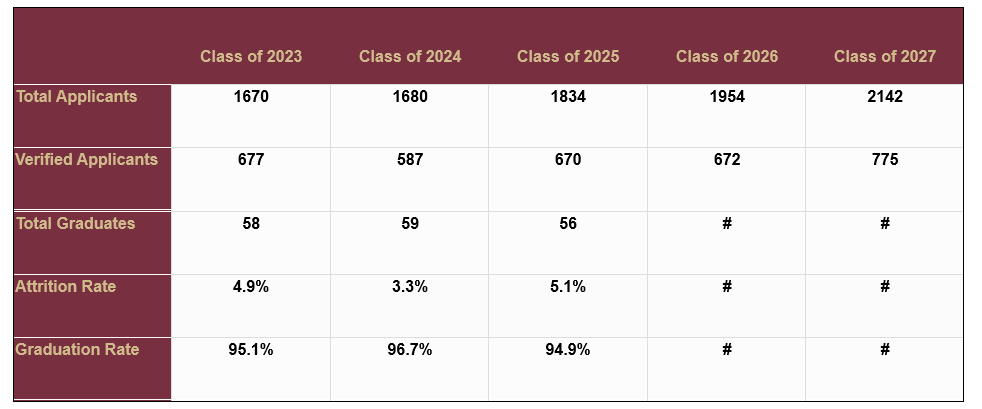
HRSA Indicators
| Class of 2023 |
Class of 2024 |
Class of 2025 |
Class of 2026 |
Class of 2027 |
|
|---|---|---|---|---|---|
| %Matriculated |
%Matriculated |
%Matriculated |
%Matriculated |
%Matriculated |
|
|
Childhood Federal and State Assistance
|
16.7 |
38.3 |
27.5 |
32.2 |
18.3 |
|
Health Provider Shortage Area or Medically Underserved Area
|
16 |
35 |
25.4 |
20.3 |
15 |
|
1st to Attend College in Family
|
13 |
30 |
30.5 |
13.5 |
25 |
|
Public Assistance
|
6 |
20 |
10.2 |
8.4 |
11 |
|
Economically Disadvantaged
|
8 |
21.7 |
27.1 |
17 |
18.3 |
|
High School Free Lunch
|
19 |
50 |
39 |
39 |
32 |
|
Low Graduation Rate in High School
|
3 |
3.3 |
3.4 |
2.0 |
1 |
|
English Not Native Language
|
3.3 |
3.3 |
3.4 |
2 |
1 |
|
Less Than 50% of Graduates go to College from Their High School
|
10 |
13.3 |
5 |
11.8 |
6 |
Class of 2023
Class of 2024
Class of 2025
Class of 2026
Class of 2027
%Matriculated
%Matriculated
%Matriculated
%Matriculated
%Matriculated
Average
Range
Average
Range
Average
Range
Average
Range
Average
Range
2,338
504-13,340
3,238
510-27,872
2,892
500-37,400
2,255
500-8,736
1930
500-6,500
3.65
3.22-4.0
3.63
3.08-4.0
3.68
3.1-4.0
3.75
3.2-4.0
3.76
3.31-4.0
3.51
3.14-4.0
3.5
3.03-4.0
3.58
3.13-4.0
3.76
3.45-4.0
3.75
3.03-4.0
303
284-316
305
282-321
305
288-330
305
283-331
302
291-319